Geospatial Analysis of Portland Breweries
1. Introduction
1.1 Background
Beer tourism is becoming increasingly common, and (fortunately) there is an abundance of choices for destinations. According to this article, over 1,000 opened in 2018. That’s a bit less than 3 per day! One of the more popular cities for beer tourism is Portland, Oregon. The wikipedia entry for Portland has a section about the beer industry in and around the city.
I went to college in Portland, but was underage and did not have the palate for good beer at the time. However, in the years since leaving Portland, I’ve become increasingly involved in the craft beer industry. Most recently, I started contributing to the OpenBreweryDB project, which seeks to catalog craft breweries across the USA and the world (currently including England and Scotland, although additional countries are anticipated in the future).
1.2 Problem
As with many large cities, Portland has quite a few distinct neighborhoods, each with its own unique personality and characteristics. It is also an interesting city in that it is bisected by a river. The industrial and business districts are mostly on the West side of the river, and the neighborhoods are to the East. Breweries are all over the place. However, our aim with this project will be to find the best neighborhood for beer - a rather high honor in a city with so many great breweries.
1.3 Interest
When a city has such a strong craft brewing industry, as Portland does, it can be difficult to choose where to begin. Beer tourism often necessitates travel by foot, for obvious reasons. As such, choosing the optimal base-of-operations for a brew tour is a key decision in travel planning. In this analysis, we will attempt to find the best locations in Portland Oregon, for a beer tourist. We cannot account for all of the personal preferences of each individual, so we will focus on density and proximity of breweries.
2. Data Acquisition and Cleaning
2.1 Data Sources
In this project I will be looking at the neighborhoods as defined on the City of Portland Open Data portal here. I will also be using the OpenBreweryDB dataset, which I help maintain. The OpenBreweryDB dataset has a number of interesting datapoints which could provide some insights. For example, the predominant ‘type’ of brewery in a neighborhood. Brewpubs and other similar establishments would likely be more prevalent in tourist areas, and larger breweries would be found in more industrial areas where land and rent are cheaper. I would expect Nano and Micro Breweries to be in neighborhoods since they could be sustained by a small local population.
2.2 Data Cleaning
For the most part, the data did not need much cleaning. However, it should be noted that most of the brewery data from the OpenBreweryDB dataset was scraped back in mid-2018, and has not been updated since. With the velocity of the craft beer industry, it’s likely that we are missing some new breweries. It is also possible that some breweries have been forced to close due to the Coronavirus pandemic or other economic forces.
3. Exploratory Data Analysis
3.1 Initial Map
I decided the first step should be to simply map out the breweries in the dataset to see if there were any obvious patterns. The resulting map can be seen below:
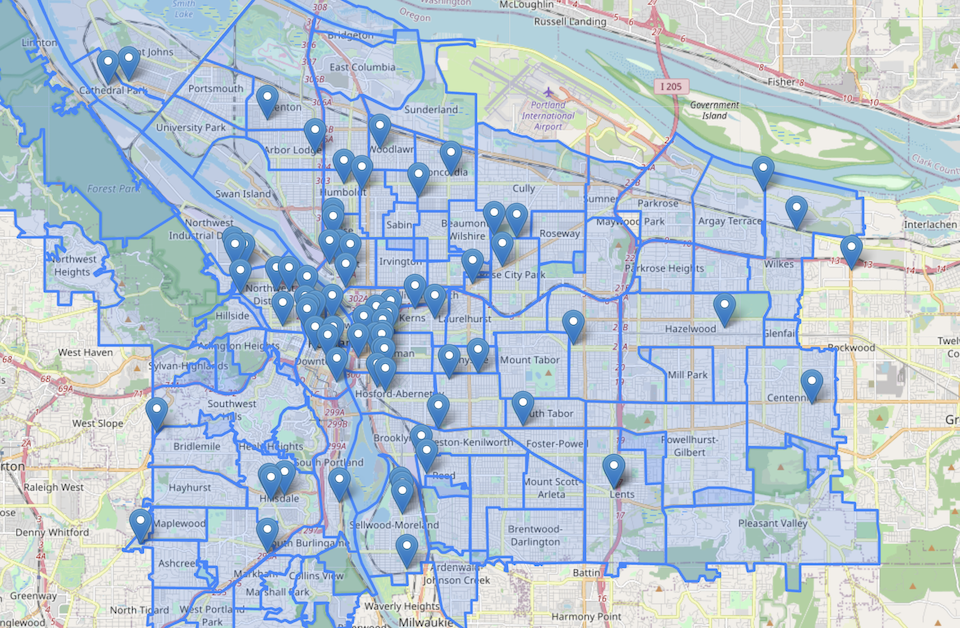
It certainly does look like the breweries are clustered in places, especially focused around the downtown core. However, it could be deceptive.
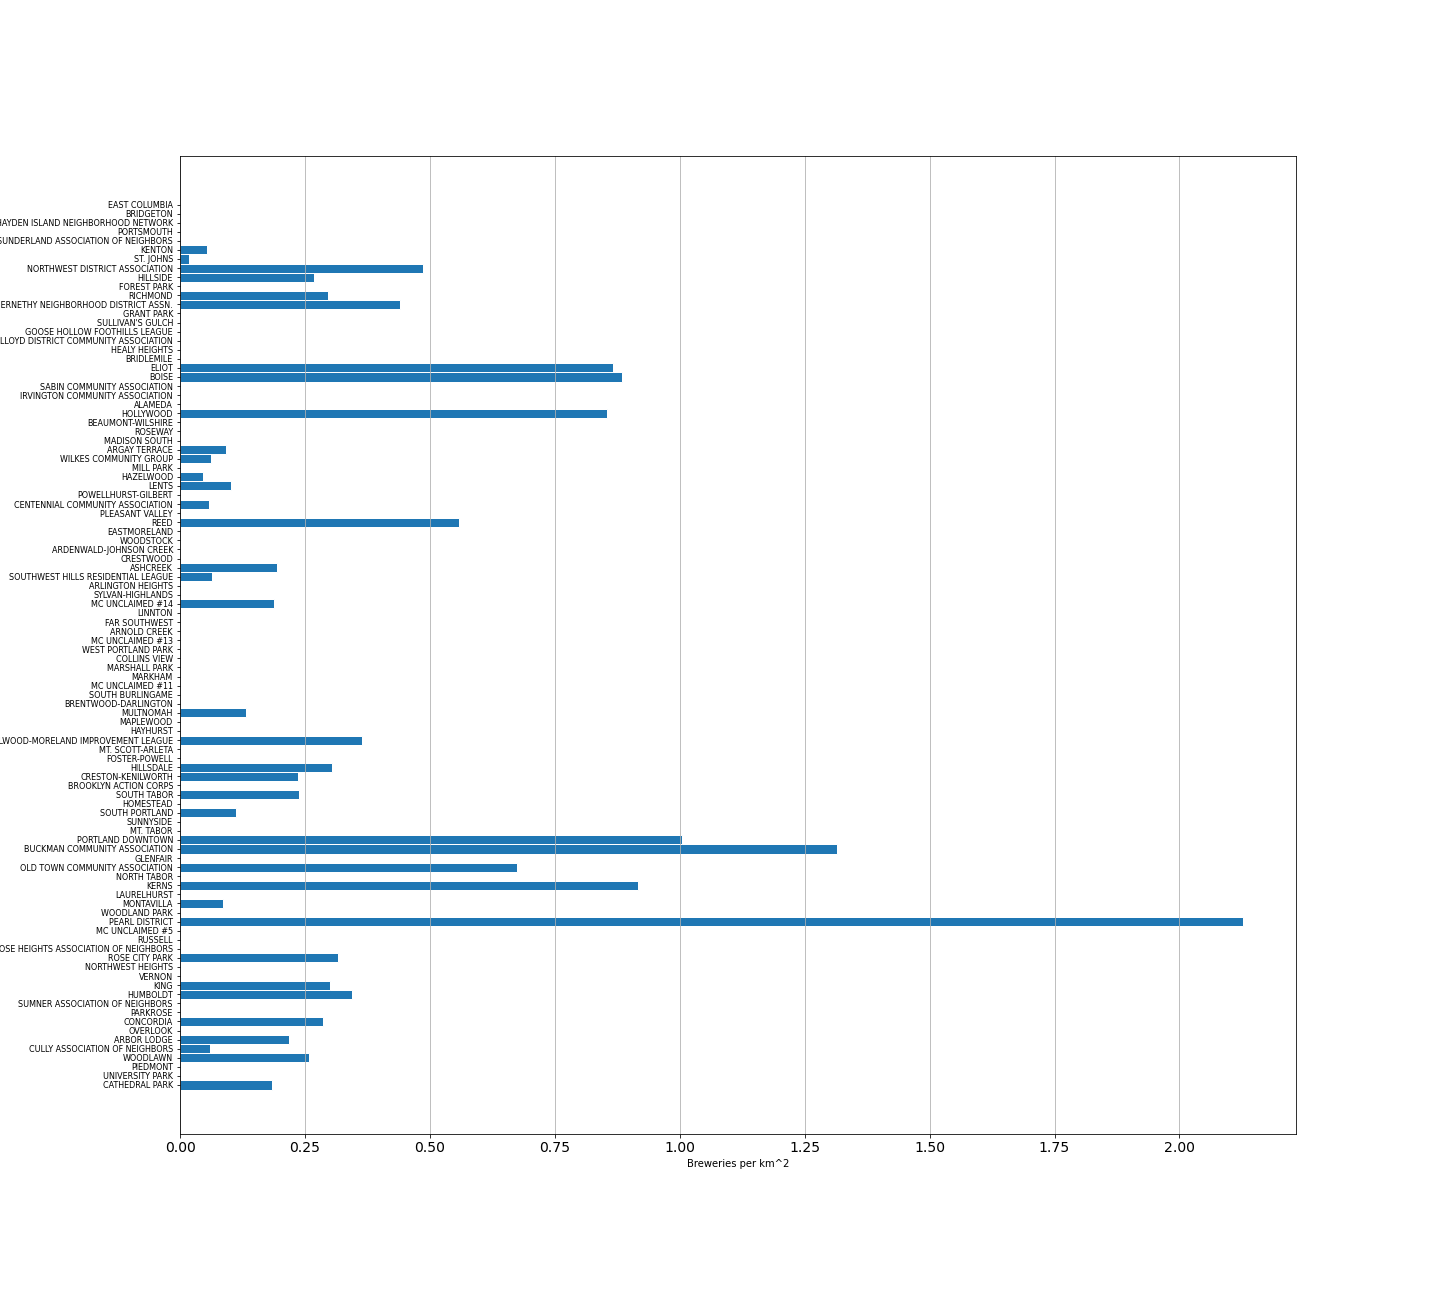
3.1 Brewery Density
I wanted to be sure that I wasn’t missing some smaller clusters where breweries were tightly clustered in one neighborhood. To check this, I needed to calculate the density of breweries in each neighborhood. My geospatial data was in degrees and not in meters, so I had to convert the neighborhood geometry to a different CRS (coordinate reference system), calculate the area in square kilometers and add it to a new column in the dataset, and then convert the geometry back to degrees for mapping. I then did a spatial join of the brewery dataset with the geometry dataset, and counted the number of breweries within each neighborhood. Using this new ‘brewery count’ data along with the ‘area’ data I already had for each neighborhood, I was able to find the density of breweries per square kilometer. I then made a horizontal bar chart showing the density for each neighborhood:
4. Machine Learning
4.1 Agglomerative Clustering
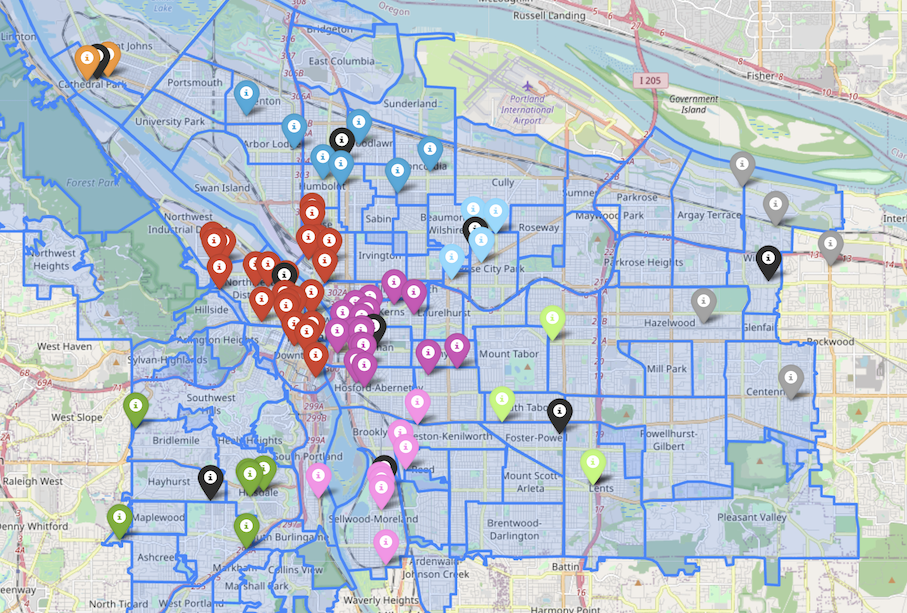
I used agglomerative clustering to cluster the breweries spatially. Initially, I used an ’n’ of 5, which seemed to be appropriate based on my eyeing up of the breweries on the map of Portland. However, it was clear that the clustering would need to be more granular to create clearly defined ‘regions’. Eventually I landed on an ’n’ of 9. The map with brewery markers colored according to their parent cluster:
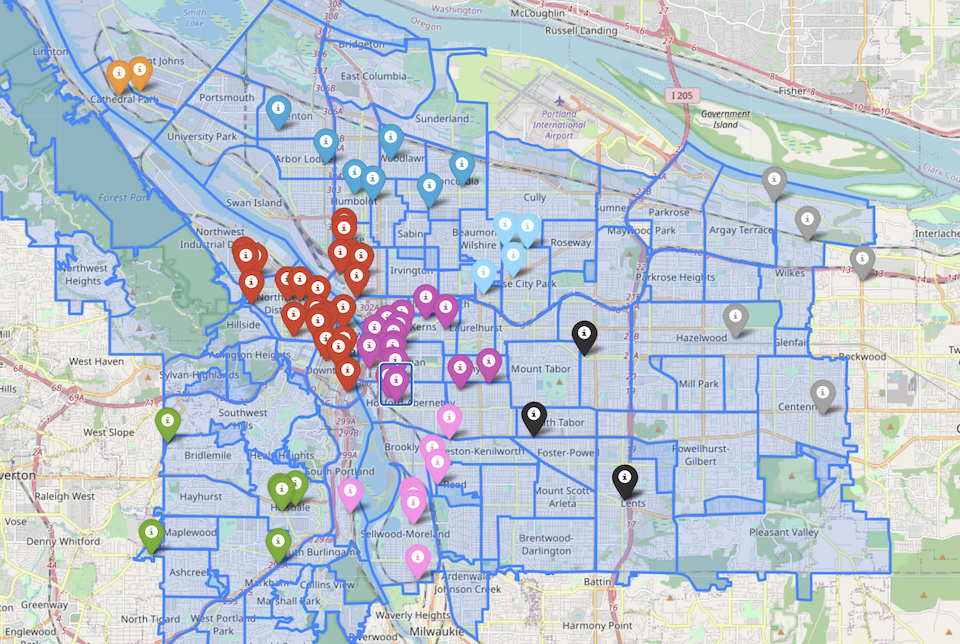
Based on the above image, it was clear that the red and purple regions were the most brewery-dense. The red region corresponds to Cluster #0, and the purple region corresponds to Cluster #4.
4.2 Finding Regional Centroids
The next step was to find the centroid of each of the regions, which would allow me to determine exactly which neighborhood occupied the center of each cluster. To do this I took the mean of the longitude and latitude values in each group, and saving that value as a new point, which I then mapped to show the centroid of each cluster. The resulting map is below:
On this map, the centroids are now visible as black markers. The final step was to run the coordinates of each of the centroids through the list of neighborhoods, to check to see if they fall within the geometry of the shape for each neighborhood. Using the resulting list of 9 neighborhoods, I created one final map, which showed all of the breweries, as well as each of the neighborhoods which falls at the center of each cluster. That map is on the next page.
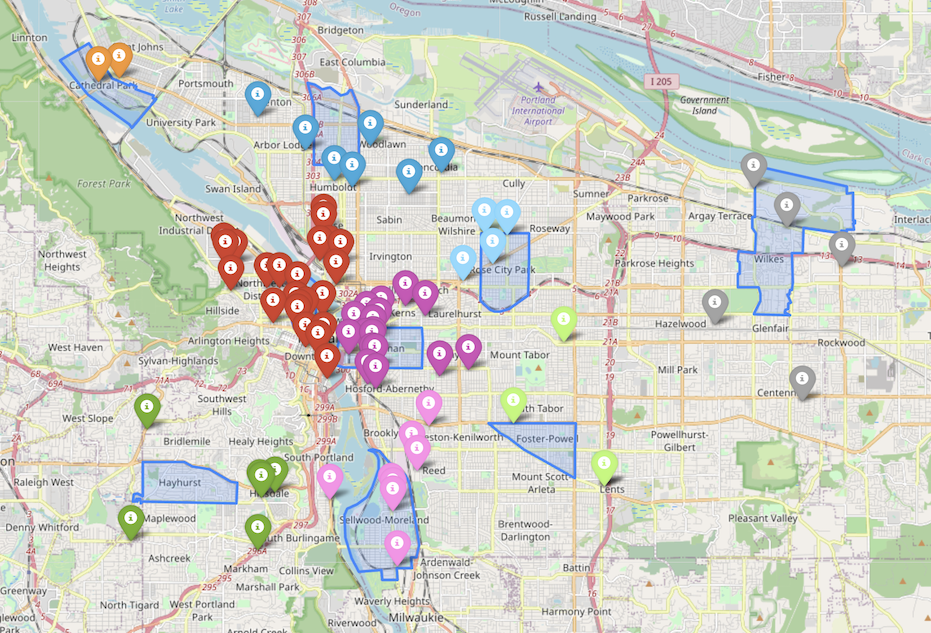
As you can see, the neighborhoods at the center of a couple of the clusters to not even hold a single brewery. However, a traveler could minimize their foot travel if they were to focus on one of these clusters and stayed in the corresponding neighborhood. These results could be even further optimized by breaking the neighborhoods down into even smaller subsections.
5. Conclusions
5.1 The ‘Best’ Beer Neighborhood in Portland
Portland is a difficult city to quantify. Ignoring the underlying map, one could pretty confidently assert that the Pearl District is the best neighborhood for beer tourism in Portland. However, some of the breweries that got clustered with the Pearl District are actually across the river, and would take longer to reach by foot or public transportation. Also, the Pearl District is much more of a ‘downtown’ area, with heavier traffic and busier streets. These traits might not be attractive to some beer tourists.
The Pearl District and Buckman Community Association were the two neighborhoods with the highest brewery densities, as well as being in the center of the two most visibly populated clusters. It’s quite obvious that these should be the primary focus for a beer tourist with their heart set on a visit to Portland, assuming the top priority is ease of access and variety of beer (isn’t it always?).
6. Links
My Jupyter notebook for this project can be found on github
The neighborhood geospatial data for Portland can be found on their open data portal
The brewery data used for this project is from OpenBreweryDB. The dataset is available via their public API, or on the project’s github
Photo Credit
Photo by Zack Spear on Unsplash